Excel templates and add-ins
Excel templates and add-ins can automate tasks to improve productivity and consistency. Reports can be created using corporate branding to build dynamic, interactive, visually appealing workbooks.
Excel reports with tables, Power Query for ETL, Pivot tables
Report templates can be developed using Power Query to extract data from data sources including databases, Excel workbooks or csv files. The data can be transformed by removing fields, filtering and reformatting.
Model & report templates can be developed with features including:
- pivot tables, pivot charts, KPIs
- tables to allow for easy filtering, slicers, calculated columns, total rows
- dynamic arrays, such as FILTER, SORT, UNIQUE to help summarise data in reports
Excel add-ins & ribbons
VBA Developer has developed a custom chart add-in so companies can use their own branding rather than using Microsoft’s default colours for your charts. The add-in has the following features:

- create custom charts using company colour branding, custom sizes reducing the time required to produce charts and ensure consistency
- custom charts optimised for use in PowerPoint in full-and half-page sizes
- reformat existing charts in custom colours
- options to format charts as in the screenshot above
Excel VBA forms and data entry
Templates with VBA forms help the data entry process allowing users to select information from lists or drop boxes instead of typing it ensuring data is correctly entered by data validation and applying business logic. Templates have been developed for quotation tools, pricing models, invoices, time sheets and expenses, see examples here.
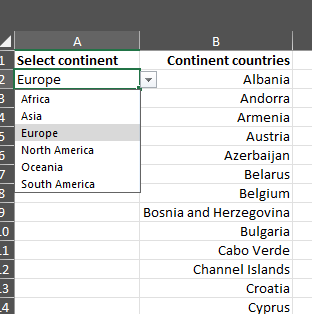
This image shows the use of dependent data dropdowns. A user can select a continent and then the list of countries will change to only display countries from that continent. We can build workbooks for you with dropdowns so users can select options rather than typing to reduce input errors.
Update existing projects
We can update and maintain your existing Excel templates and add-ins e.g., add custom ribbons, new functionality, optimise workbooks to improve performance and advise of development options
Technical documentation
We can produce technical and user documentation for your projects and update existing documentation.